


By Sophie Arthur
October 19, 2020
Time to read: 4 minutes
By Dr Sophie Arthur
The majority of the cells in our body contain two metres of DNA. All of this genetic information needs to be packaged up into the nucleus of the cell, which is just 0.01 millimetres wide. For comparison, the width of a human hair is 0.1 millimetres. Packing a DNA molecule into something with dimensions ten times smaller than those of a human hair takes a lot of organisation.
Within the nucleus of the cell, the DNA is organised into structures called chromosomes. Humans have 23 pairs of chromosomes, so 46 in total. Previous research has shown that these 46 molecules don’t intertwine together within the nucleus, like pieces of spaghetti on a plate, but that each chromosome has its own space.
Understanding how all of this genetic material is structured is vital for our knowledge about a cell functions properly. A mutation that affects the packaging of the DNA can lead to developmental conditions, cancers, neuronal disorders and more. This array of potential detrimental effects means that researchers need to be able to monitor how DNA is packaged at high resolution. This has been possible for about 10 years now, but so far most analyses comparing 3D genome organisation have been carried out by looking at the data by eye, or over-simplified approaches. While useful, this is seriously time consuming, and it could be overlooking important information.
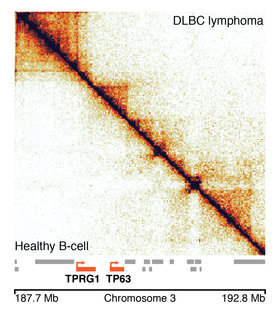
Research from the Developmental Epigenomics group at the MRC LMS and the Max Planck Institute for Molecular Biomedicine in Germany, published today in the journal Nature Genetics, describes a new tool to help overcome these issues. Using a computational technique called ‘structural similarity analysis’, the team has developed an algorithm which compares the DNA organisation data from a healthy individual with that of a cancer patient, for example. Through work in collaboration with researchers at the National Centre for Genomic Analysis from the Centre for Genome Regulation in Barcelona, the algorithm can then identify which regions are packaged differently in the cancer patient, to help identify what might have gone wrong.
The algorithm works in a similar way to passport control at the airport. Your passport photo is the reference image. The electronic booth tries to match that reference photo to your face on the day you are travelling, and if there is enough similarity then it lets you through. Here, the algorithm applies this same concept to 3D genome data. It uses the healthy individual’s data as a reference, and tries to spot any differences in the cancer patient’s data.
This tool helps researchers to scan the entire length of the DNA in an automated process, and much more quickly than by eye. It also allows researchers to give a region of the genome a numerical value. Before, they would only have been able to say whether a given section of DNA was different or not. Now, the algorithm assigns regions of DNA a numerical value that denotes just how different that region is, say in a healthy person compared with a cancer patient. The tool can also highlight differences in regions in which the human eye can see no difference at all. It can also help to analyse data from a group of patients much more quickly.
Juanma Vaquerizas, Head of the Developmental Epigenomics group at the MRC LMS and senior author of the study, discussed the implications for this research:
“This tool will be used for fundamental biology research and will have direct applications within that. For example, a lot of cancers display chromosome translocations and rearrangements where parts of a chromosome can break and reattach to the wrong chromosome, causing all sorts of problems. This is a feature of many other diseases too.”
Another unique feature of this tool, which the team named CHESS (Comparison of Hi-C Experiments using Structural Similarity), is that you can compare the 3D genome organisation between different species, which could help to identify areas that are conserved across evolution. “There isn’t another available tool that can systematically perform this analysis. This really opens up the possibility of having a quantitative and a systematic approach at characterising how genome organisation changes between different samples or species”, discuss Silvia Galan and Nick Machnik, joint-first authors of the study.
‘CHESS enables quantitative comparison of chromatin contact data and automatic feature extraction’ was published on 19 October in Nature Genetics. Read the full article here.