Gene mapping technique promises to unlock the power of proximity to help locate genes implicated in disease.
Scientists have devised a powerful new technique that “maps” the genome of a cell in a way that sheds light on the detailed interactions between genes and their control sequences, or enhancers.
The researchers say the technique promises to help explore key aspects of gene regulation, such as how it can play a role in the expression of a gene even when enhancers located far away from a gene itself along the length of the genome.
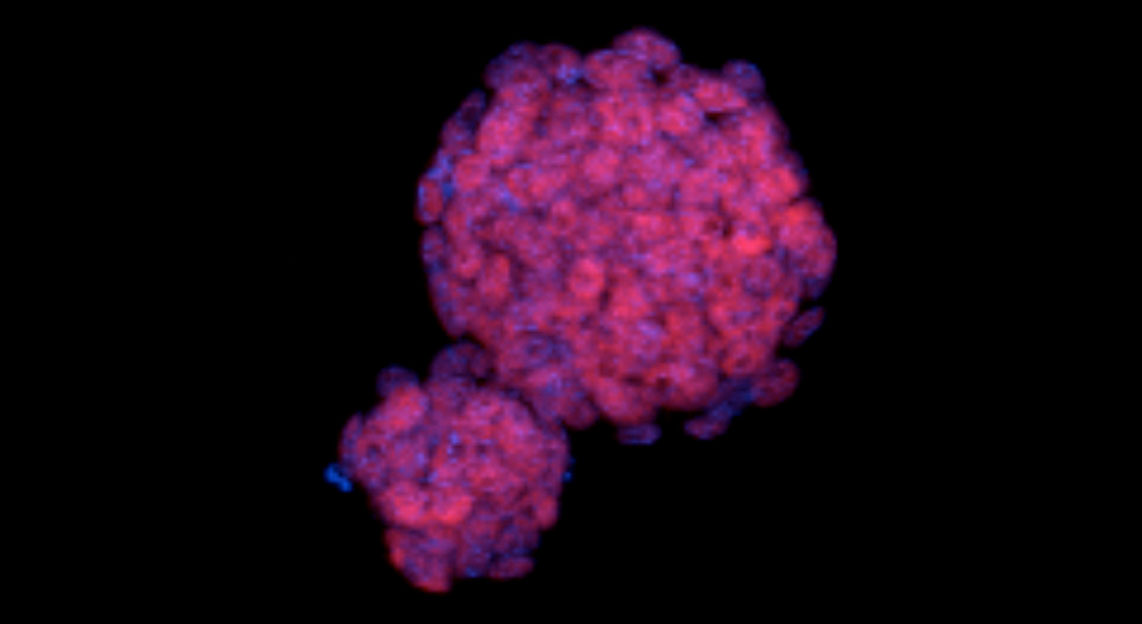
Colonies of mouse embryonic stem cells. show cell nuclei (blue). DNA from the nuclei is sequenced to infer the relative positions of genes and their switches. Image credit: C. Ferrai, MDC
A packaging problem
Cells face the daunting task of packing a thread of genetic material that is several metres long into a nucleus that measures only five micrometres across. This origami creates spatial interactions between genes and their control sequences, or switches, which can affect human health and disease. The new technique, called Genome Architecture Mapping, or GAM, is described in a paper published today in Nature. The researchers describe GAM as a powerful new way to “map” this three-dimensional geography of the entire genome, initially the mouse genome, but eventually for the human genome too.
Genes are activated to produce RNAs and proteins, then switched off again when the molecules are no longer needed. Both the gene and its switches are DNA sequences, and they may lie far apart on the linear genome. This presents a challenge for the cell, because these regions usually have to be brought into contact to activate the gene.
It also creates a problem for scientists trying to understand one of the central questions in biology: how do cells decide which genes should be activated, and when? The answer will partly depend on matching every gene to its control sequences. But DNA strands are too thin to be tracked under the microscope, and even if that were possible, you’d have the vast amount of DNA in the nucleus to contend with.
The new approach has taken a decade to evolve from the original concept to a fully-fledged laboratory method, partly because it relies heavily on DNA sequencing, whose speed has risen as dramatically as its cost has fallen in recent years.
The technique involves freezing cells in-situ, then taking thin slices from many cell nuclei. The tiny amount of DNA within each slice of the nucleus is then sequenced, and the team deploys a mathematical model, called SLICE (Statistical Inference of Co-segregation), to identify “hotspots” of increased physical interaction between genes and their enhancers within the sample slices. The model looks at the frequency with which different genomic regions appear in the slice to infer information about the positions of genes and their enhancers.
The team infers positional information about genes and their enhancers by looking at the frequency with which different genomic regions appear in the slices, explained joint lead author Ana Pombo, who began the project whilst working at the MRC London Institute of Medical Science (LMS), and is now based at the Berlin Institute for Medical Systems Biology of the Max Delbrück Centre for Molecular Medicine in the Helmholtz Association (MDC).
“An analogy might be this: if you want to understand how research scientists interact from where they sit in the canteen of their institute, you might take some occasional photographs,” Pombo said. “If you do this many times over a year, you will begin to see a pattern in who sits frequently next to each other, or who sits frequently at the window. By looking at these random snapshots you will perhaps be able to figure out who are collaborators. If you do that many times over a month, you will begin to see a pattern in those who often sit next to each other. These random snapshots might tell you about their social interactions.”
“This is made possible by filtering out random encounters from real interactions using mathematical methods,” says joint-lead author Mario Nicodemi at the Università di Napoli Federico II, who conceived the SLICE model and, aided by his PhD student Antonio Scialdone, developed it.
“We knew how to do cryo-sectioning, and we thought what if we could find out which DNA sequences were present in each slice, then we could figure out how the genome is organised,” Pombo said. “But this was just a dream in 2004, when we first had this idea. Paul Edwards, of the Hutchison/MRC Research Centre and Department of Pathology at the University of Cambridge, and I had the initial idea before the techniques necessary to do the experiment were available. My lab at the LMS optimised the approach, and as new technical steps came along we added them to our method.”
The Power of Three
“People have been measuring two-way contacts for a long time and they’ve often seen that you can have a set of different DNA elements that interact with each other in a pairs: X with Y, Y with Z, X with Z,” explained Robert Beagrie, joint first author on the paper, who collected all the data and was a PhD student with Ana Pombo when both worked at the LMS and is now based at the University of Oxford. “People have used that information to infer the existence of contact between more than two regions, and have been able to use microscopy to see some such three-way interactions”
Using their GAM technique, the researchers have already spotted increased levels of so-called ‘three-way contacts’ in regions of the genome that are vigorously expressed in mouse embryonic stem cells. They have identified thousands of such sites, where only a handful had previously been identified. The team is confident that once it becomes feasible to collect a larger dataset, they will be able to seek out other multiple contacts, possibly including up to 5- or 7-way contacts.
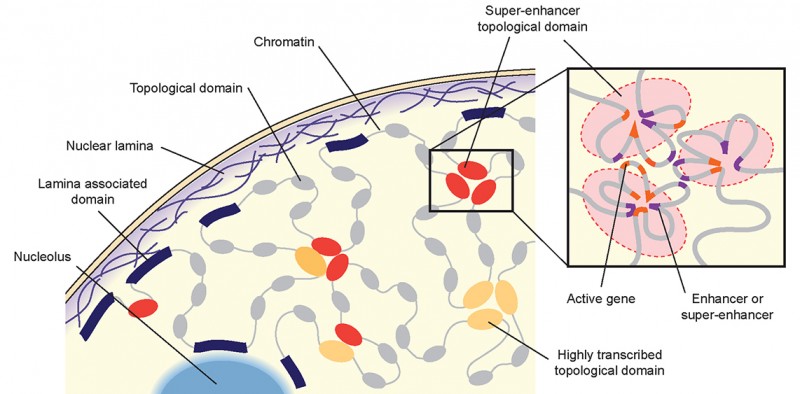
The nucleus of a cell with DNA organised in topological domains which contact each other. Inset: Within domains, genes (red) are activated through close contact with their switches (violet). Credit: Beagrie et al. (2017), Nature (2017) doi:10.1038/nature21411
“With this new approach we are able to generate a genome-wide catalogue of all the regions that we are confident interact in threes,” Beagrie explained. That gives us much more power to try to identify features of those regions which might predict whether they are interacting in higher numbers together at the same time, or pair-wise, or not at all.”
Pombo explained that previous studies have identified two-way contacts, but do not indicate how often such contacts take place, and by implication how important they might be. “They can spot that you and I are friends, but not whether we are very strong friends relative to everyone else. They were good at identifying interactions but not in a quantitative manner,” Beagrie said.
The team has also established that three-way clusters of genomic regions can often contain “super-enhancers” – especially potent enhancer regions, though this apparent preference for clustering requires further research. “By exploiting the unique nature of GAM data, mathematical models can reliably identify multiple, group interactions that could play a key role in the regulation of genes”, explained Nicodemi.
According to Beagrie, the most notable advance of the technique over those available at the moment is its applicability to the study of rare cell types within tissues. He explained that existing methods require very pure populations of the cell type you are interested in.
In practice this means culturing cells, which is not only time consuming, but also disruptive of the tissue. The beauty of the GAM approach is that the tissue is kept intact and frozen before the key steps take place, with the promise of yielding more reliable, and perhaps more instructive, information.
“With this technique we can do the slicing, the cryo-sectioning, directly from the tissue without disrupting it. So the potential is there to look at cell types embedded within a larger population of other cells that we are not so interested in.”
This potential is already attracting interest from scientists in other fields, for example those trying to understand genetic variation: “There is a huge potential for applying this in human tissue samples to catalogue contacts between regulatory regions and their target genes, and to use them to understand genetic variation and how this might alter aspects of nuclear biology, “ Pombo said.
She says that interest has been shown by other scientists, including researchers looking at the role of parasitic versus host DNA, or interactions between retroviruses and hosts, such as an HIV-infected cell. Cancer scientists too are keen to explore use of the technique to create maps of particular areas of a tumour, Pombo said.
Closer to home, Beagrie explained that there is much to learn from being able to identify which enhancer regulates which gene in his own field, and that the GAM technique adds a new dimension. “Because we can look at multiple contacts at the same time we can ask: is a gene being contacted at the same moment by all of its enhancers, or by each enhancer one at a time? Could different enhancers of a given gene have different functions in regulating the steps in the expression of that gene, and what is the timing of those interactions?”
“We know that many genes, in particular those that are important for early development, do have multiple enhancers – but the reason why and how those multiple enhancers are acting to regulate the gene is an unanswered question.”
Contact:
Susan Watts
Head of Communications and Public Engagement
MRC London Institute of Medical Sciences (LMS)
Hammersmith Hospital campus
Du Cane Road, London W12 0NN
T: +44 (0) 208 3838247
M: +44 (0) 7590 250652 E: susan.watts@lms.mrc.ac.uk
@MRC_LMS
MRC London Institute of Medical Sciences is the new name of the MRC Clinical Sciences Centre