


By Lindsay Keith
June 25, 2021
Time to read: 8 minutes
Written by Peter Sarkies, Head of the Epigenetic Inheritance and Evolution group at the MRC LMS.
When we think of a scientific discovery, we typically imagine a “eureka” moment, in which someone in a white coat glimpses the result of an experiment and in one stroke, solves one of life’s major questions. However, it is important to realise that a key aspect of scientific progress involves the development of new tools that help make previously insoluble research questions accessible. One important example of this is tools that help scientists to see better. We’re all familiar with many of these tools and how they were instrumental in biology – from the microscope that enabled cells to be seen for the first time, through to more recent tools such as electron microscopy that made visible the fine inner structure of the cell, and X-ray crystallography enabling scientists to work out the position of each atom in a protein. What might be a little less obvious is how important more abstract modes of visualisation can be in helping scientists to make progress in understanding research questions.
In an abstract visualisation, the aim is to take information, often very complex, and transform it in a way that the human eye finds easier to take in, compare and understand. A really key example of this that has been crucial in biology over the last few years is the Genome Browser. Scientists use this tool to visualize and browse entire genomes with annotated data including gene prediction and structure. Genome browsers are really good for looking at the organisation of genes within the genome. However, they suffer from the fact that the way they present the information is linear. It’s therefore difficult to quickly compare different features across a genome, and very difficult to compare the entire composition of several genomes without losing a lot of detail.
I became keenly aware of this problem a few years ago because my laboratory is interested in a particular type of genome feature known as a transposable element, or TE for short. Transposable elements are genomic parasites- I’ve blogged about them before here. They can be thought of as viruses that have lost the ability to spread between cells but instead make copies of themselves that end up in other places in the genome. Surprisingly the composition of transposable elements is hugely variable across genomes. Whilst some organisms have very few TEs, such as yeast which only has a handful in its entire genome, genomes of many species like mammals are around 50% TEs (for comparison, genes make up around 1% of the human genome!). The reasons underpinning this huge diversity are mysterious and a major area of interest for my lab.
One theory for why genomes might have different amounts of transposable elements is that different species have different mechanisms that protect the genome against TEs. One example is a type of small RNA known as piRNAs (Piwi interacting RNAs). These RNAs are produced by the genome and can recognise TE sequences through base pairing. This nullifies the TE and can stop it from spreading. piRNAs are very ancient and are found across animals; however, my work has uncovered that not all species have them. In particular many nematode worms, including many parasitic nematode worms that cause disease in humans and animals, have lost this pathway altogether and therefore do not make any piRNAs at all. Could it be that differences in piRNA silencing could explain some of the diversity in TE content across genomes?
To study this question we had to compare TE content across lots of animals and then link this to whether they had piRNAs. People have looked at this before and found no differences, but they had only looked at the total number of TEs and not really at more intricate features of genomes. Many hundreds of animal genomes have been studied so that most of the sequence of letters is known. From this we could identify many of the TE sequences. However, simply adding up the number of TEs or the number of base pairs of TEs loses a lot of information about the different types and the specific structure of each individual TE. It would also be impossible to look through every single genome on a browser and compare it. So, we needed to develop a much better method. When a PhD student, Lisa Schneider, joined my lab a few years ago, we decided that this would be a really interesting project for her to work on.
Crucial to this endeavour was a collaboration that we formed early on with David Birch and Yi-Ke Guo at the Imperial College Data Sciences Institute. David and Yi-Ke are specialists in developing new ways to look at “big data”, and together with them we decided to use a type of visualisation method known as Networks in order to look at TEs. In essence, a network is an image of relationships. Typically, there are a large number of blobs, known as “nodes”, which are connected to each other by a series of edges of different thickness (or “weight”) and the thickness represents some aspect describing the connection between them. For example, you could draw a network to represent social connections- each “node” would be a different person, connected to all the other people that they see socially, and the more often they see a particular person the thicker the connection between them would be.
Such networks have been used before in biology, in particular looking at interactions between different proteins. But we came up with a new idea to use them to look at TEs within genomes. We designed a special type of network called a bipartite network in which there are two types of nodes. One set of nodes was different types of TEs and the other was different animals. We connected each TE type to each animal and the weight of this edge was determined by how many TEs of that type are present in that animal’s genome. We could do this for all the genomes and TE families and then use a computer to organise the network automatically on the basis that strong edges should pull nodes closer together than weak ones (a bit like spheres connected by strong or weak springs).
An example of one of these pictures is shown below on the right. To me, it looks a little like a Kandinsky work of abstract art (his painting called Circles, which hangs in the Philadelphia Museum of Art, is shown on the left for comparison). The blotches of colour are clusters, where there are a large number of different animal genomes and TE types that the computer algorithm has grouped together due to strong edges between them.
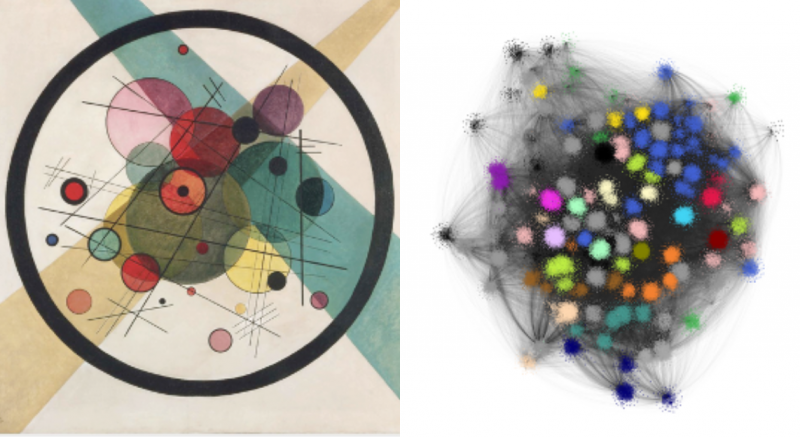
In addition to their striking appearance, the really important thing about these networks was that they provide extra information from the layout of different animal genomes and different TE types. One parameter that we looked at is called “degree”, which is a measurement of how connected a genome is to different TE types. This can be interpreted as a measure of the diversity of TE types within the genome.
Fascinatingly, the diversity of TE types was much higher in the genomes of animals that have piRNA silencing mechanisms compared to those that don’t. At first, this might seem a bit surprising, because the piRNAs are supposed to silence TEs, but this conundrum is solved by the fact that the overall number of TEs is on average the same whether the animal has piRNA silencing or not. In other words, animals with piRNAs have lots of different TE types, but each type is rare, whereas animals without piRNAs have a small number of different types of TEs but each type is more likely to be common. This makes sense because if piRNAs are present then each TE type has a smaller chance of being able to spread and so is less likely to accumulate. It is also less dangerous to the genome to have lots of different types of TEs because the piRNAs mean that each one does less damage.
Overall, our work shows how important visualisation can be as a tool to transform information into a form that is easier for the human mind to comprehend. We’re hoping to use our network method for further questions about transposable elements. One particular avenue of interest is in studying cancer, because we know that TEs can become activated in cancer but the reasons and consequences of this are unknown. And it’s also a reminder that an artistic slant can sometimes be useful in stimulating scientific progress!
‘Network-based visualisation reveals new insights into transposable element diversity’ was published online on 25 June 2021 in Molecular Systems Biology. Read the full article here.